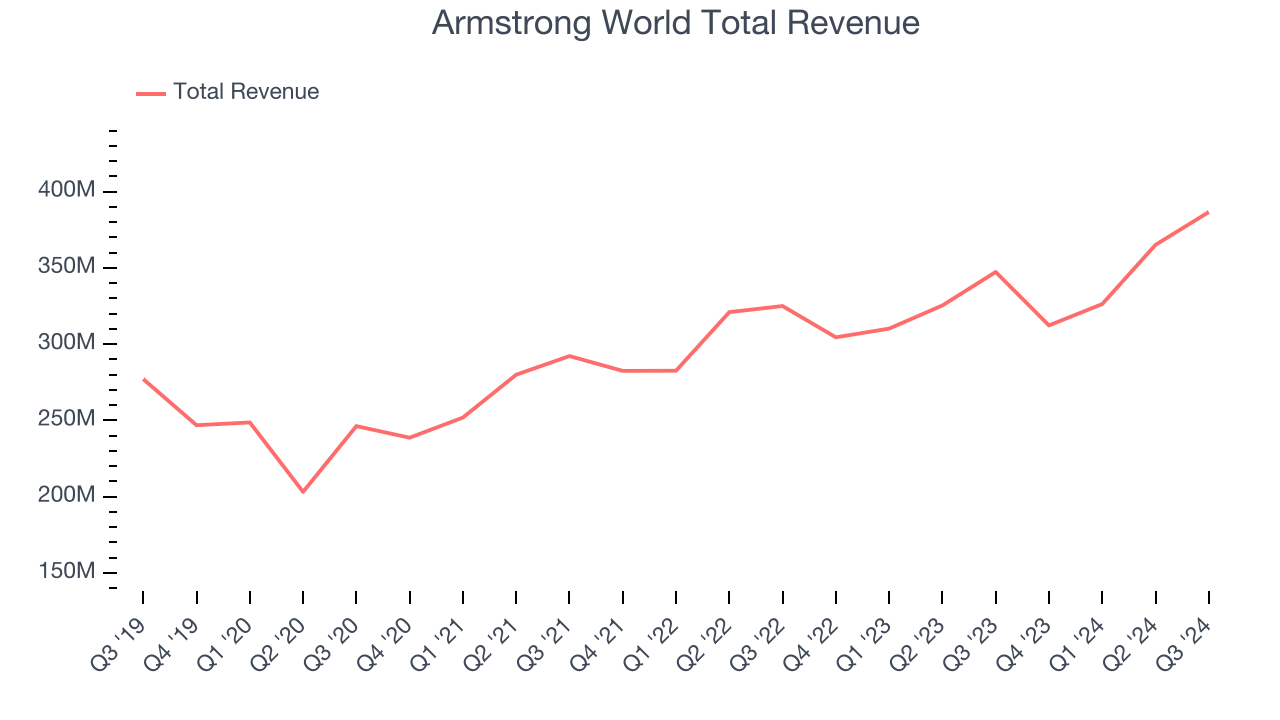
Ceiling and wall solutions company Armstrong World Industries (NYSE:AWI) met Wall Street’s revenue expectations in Q3 CY2024, with sales up 11.3% year on year to $386.6 million. The company’s outlook for the full year was also close to analysts’ estimates with revenue guided to $1.43 billion at the midpoint. Its non-GAAP profit of $1.81 per share was 3.2% above analysts’ consensus estimates.
Is now the time to buy Armstrong World? Find out by accessing our full research report, it’s free.
Armstrong World (AWI) Q3 CY2024 Highlights:
- Revenue: $386.6 million vs analyst estimates of $386.7 million (in line)
- Adjusted EPS: $1.81 vs analyst estimates of $1.75 (3.2% beat)
- EBITDA: $139 million vs analyst estimates of $136.4 million (1.9% beat)
- The company reconfirmed its revenue guidance for the full year of $1.43 billion at the midpoint
- Adjusted EPS guidance for Q4 CY2024 is $6.20 at the midpoint, above analyst estimates of $1.33
- EBITDA guidance for the full year is $486 million at the midpoint, in line with analyst expectations
- Gross Margin (GAAP): 42.4%, up from 40.7% in the same quarter last year
- Operating Margin: 28.8%, in line with the same quarter last year
- EBITDA Margin: 36%, in line with the same quarter last year
- Free Cash Flow Margin: 27.7%, up from 22.6% in the same quarter last year
- Market Capitalization: $6 billion
“With another quarter of record setting sales and strong earnings growth, we continue to demonstrate our ability to deliver growth despite muted market conditions through operational execution and our investments in strategic acquisitions, innovation and digital initiatives,” said Vic Grizzle, President and CEO of Armstrong World Industries.
Company Overview
Started as a two-man shop dating back to the 1860s, Armstrong (NYSE:AWI) provides ceiling and wall products to commercial and residential spaces.
Building Materials
Traditionally, building materials companies have built competitive advantages with economies of scale, brand recognition, and strong relationships with builders and contractors. More recently, advances to address labor availability and job site productivity have spurred innovation. Additionally, companies in the space that can produce more energy-efficient materials have opportunities to take share. However, these companies are at the whim of construction volumes, which tend to be cyclical and can be impacted heavily by economic factors such as interest rates. Additionally, the costs of raw materials can be driven by a myriad of worldwide factors and greatly influence the profitability of building materials companies.
Sales Growth
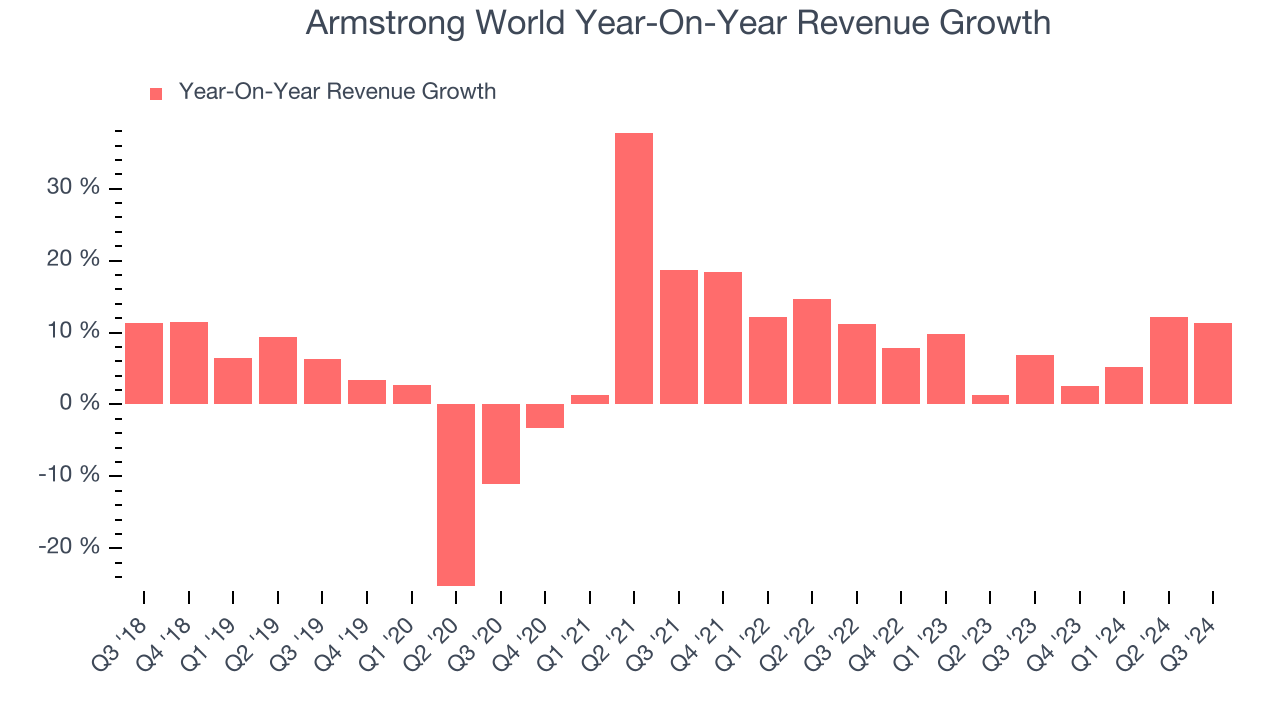
Reviewing a company’s long-term performance can reveal insights into its business quality. Any business can have short-term success, but a top-tier one sustains growth for years. Regrettably, Armstrong World’s sales grew at a mediocre 6.2% compounded annual growth rate over the last five years. This shows it couldn’t expand in any major way, a tough starting point for our analysis.

We at StockStory place the most emphasis on long-term growth, but within industrials, a half-decade historical view may miss cycles, industry trends, or a company capitalizing on catalysts such as a new contract win or a successful product line. Armstrong World’s annualized revenue growth of 7.1% over the last two years aligns with its five-year trend, suggesting its demand was consistently weak. 
This quarter, Armstrong World’s year-on-year revenue growth was 11.3%, and its $386.6 million of revenue was in line with Wall Street’s estimates.
Looking ahead, sell-side analysts expect revenue to grow 8.3% over the next 12 months, an improvement versus the last two years. This projection is above the sector average and illustrates the market thinks its newer products and services will fuel higher growth rates.
Unless you’ve been living under a rock, it should be obvious by now that generative AI is going to have a huge impact on how large corporations do business. While Nvidia and AMD are trading close to all-time highs, we prefer a lesser-known (but still profitable) semiconductor stock benefitting from the rise of AI. Click here to access our free report on our favorite semiconductor growth story.
Operating Margin
Operating margin is an important measure of profitability as it shows the portion of revenue left after accounting for all core expenses–everything from the cost of goods sold to advertising and wages. It’s also useful for comparing profitability across companies with different levels of debt and tax rates because it excludes interest and taxes.
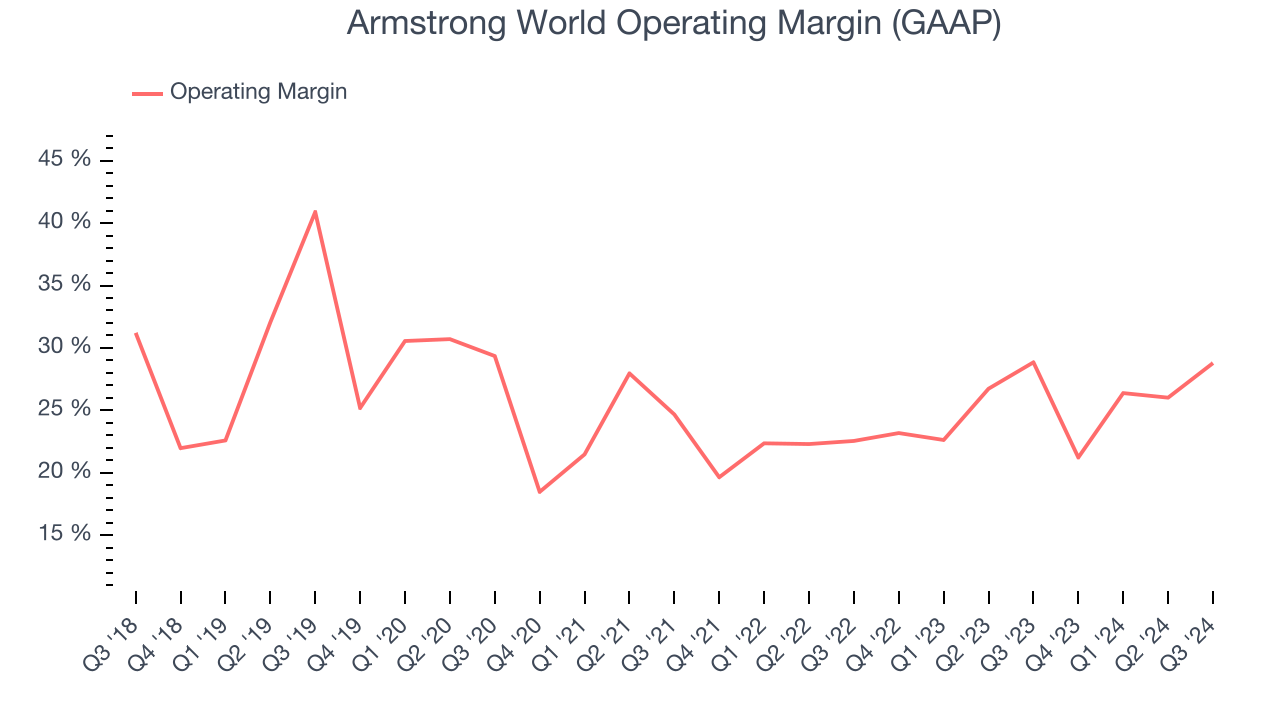
Armstrong World has been a well-oiled machine over the last five years. It demonstrated elite profitability for an industrials business, boasting an average operating margin of 25%. This result isn’t surprising as its high gross margin gives it a favorable starting point.
Looking at the trend in its profitability, Armstrong World’s annual operating margin decreased by 3.1 percentage points over the last five years. Even though its margin is still high, shareholders will want to see Armstrong World become more profitable in the future.

This quarter, Armstrong World generated an operating profit margin of 28.8%, in line with the same quarter last year. This indicates the company’s cost structure has recently been stable.
Earnings Per Share
Analyzing revenue trends tells us about a company’s historical growth, but the long-term change in its earnings per share (EPS) points to the profitability of that growth – for example, a company could inflate its sales through excessive spending on advertising and promotions.
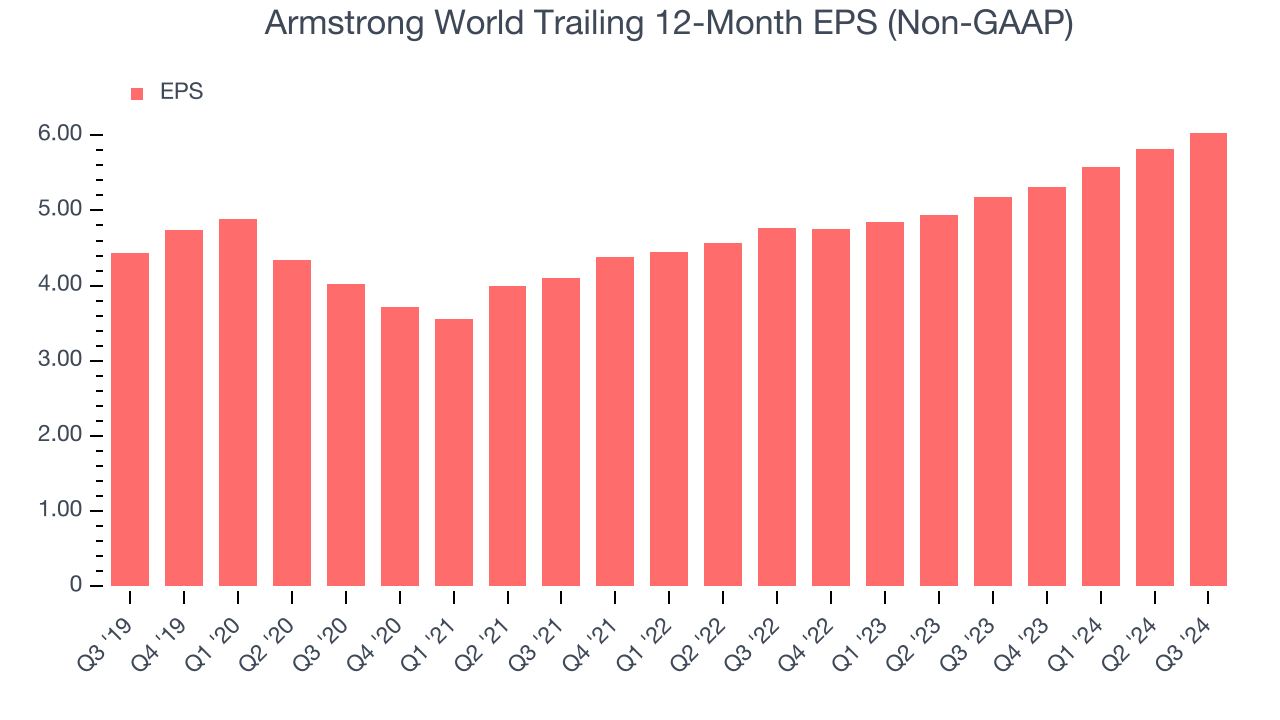
Armstrong World’s unimpressive 6.4% annual EPS growth over the last five years aligns with its revenue performance. This tells us it maintained its per-share profitability as it expanded.

Like with revenue, we analyze EPS over a more recent period because it can give insight into an emerging theme or development for the business.
Armstrong World’s two-year annual EPS growth of 12.6% was great and topped its 7.1% two-year revenue growth.In Q3, Armstrong World reported EPS at $1.81, up from $1.60 in the same quarter last year. This print beat analysts’ estimates by 3.2%. Over the next 12 months, Wall Street expects Armstrong World’s full-year EPS of $6.04 to grow by 9.2%.
Key Takeaways from Armstrong World’s Q3 Results
We were impressed by Armstrong World’s optimistic EPS forecast for next quarter, which blew past analysts’ expectations. We were also glad its EBITDA outperformed Wall Street’s estimates despite in line revenue. Overall, this quarter had some key positives. The stock remained flat at $137.30 immediately after reporting.
Is Armstrong World an attractive investment opportunity right now?The latest quarter does matter, but not nearly as much as longer-term fundamentals and valuation, when deciding if the stock is a buy. We cover that in our actionable full research report which you can read here, it’s free.


