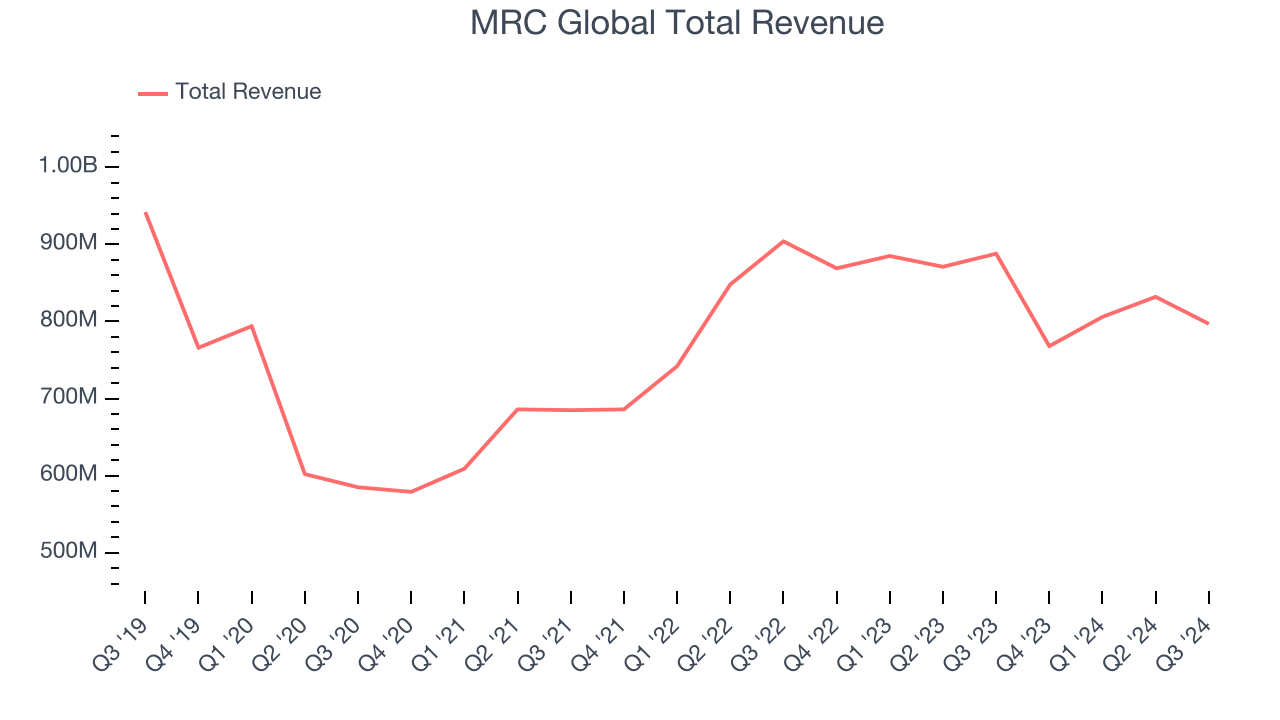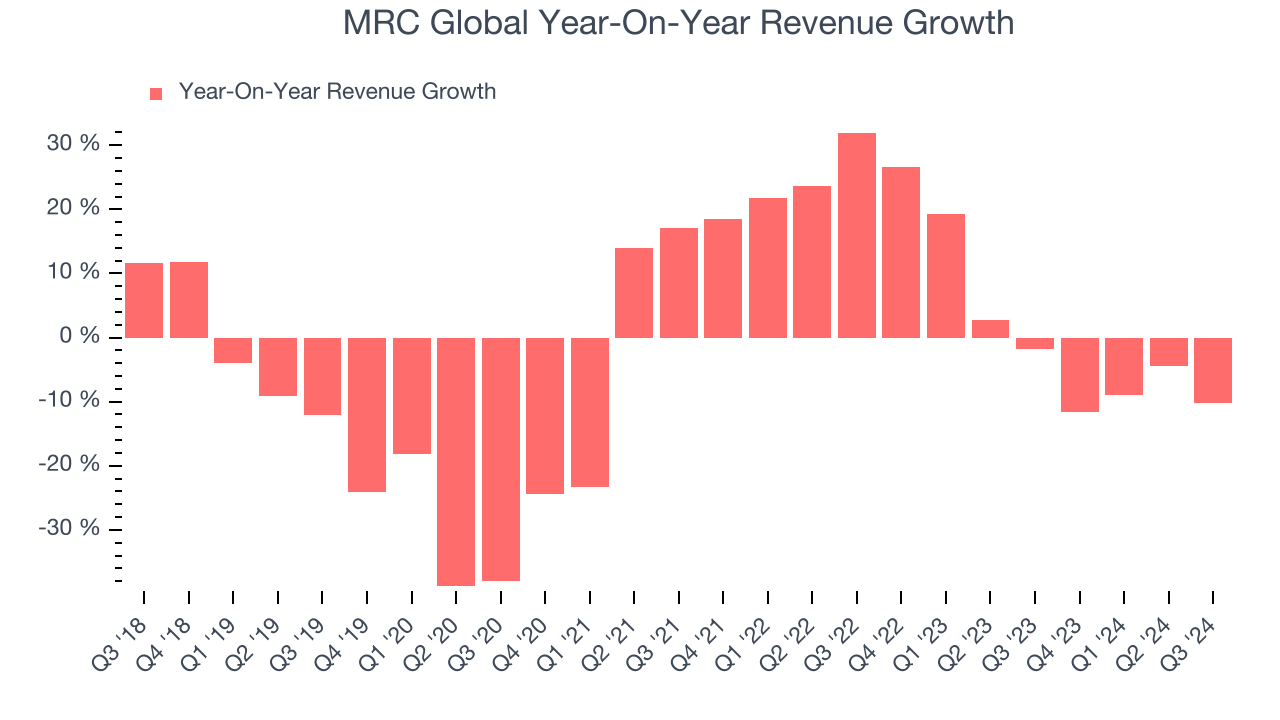
Fluid and gas handling company MRC (NYSE:MRC) met Wall Street’s revenue expectations in Q3 CY2024, but sales fell 10.2% year on year to $797 million. Its non-GAAP profit of $0.22 per share was 15.8% above analysts’ consensus estimates.
Is now the time to buy MRC Global? Find out by accessing our full research report, it’s free.
MRC Global (MRC) Q3 CY2024 Highlights:
- Revenue: $797 million vs analyst estimates of $797 million (in line)
- Adjusted EPS: $0.22 vs analyst estimates of $0.19 (15.8% beat)
- EBITDA: $48 million vs analyst estimates of $48.1 million (small miss)
- Gross Margin (GAAP): 20.1%, in line with the same quarter last year
- Operating Margin: 4.6%, down from 6.4% in the same quarter last year
- EBITDA Margin: 6%, down from 7.9% in the same quarter last year
- Free Cash Flow Margin: 16.7%, up from 10.7% in the same quarter last year
- Backlog: $580 million at quarter end
- Market Capitalization: $1.04 billion
Rob Saltiel, MRC Global’s President and CEO, stated, “As we guided on our last earnings call, revenue and Adjusted EBITDA declined in the third quarter due to slowing activity in the U.S. oilfield and project delays in our DIET sector. Despite these headwinds, we generated operating cash flow of $96 million, bringing our 2024 total to $197 million, essentially achieving our full year cash flow target of $200 million a quarter early. Given our robust cash flow generation, we are raising our guidance for the full year operating cash flow to $220 million or more.
Company Overview
Producing bomb casings and tracks for vehicles during WWII, MRC (NYSE:MRC) offers pipes, valves, and fitting products for various industries.
Infrastructure Distributors
Focusing on narrow product categories that can lead to economies of scale, infrastructure distributors sell essential goods that often enjoy more predictable revenue streams. For example, the ongoing inspection, maintenance, and replacement of pipes and water pumps are critical to a functioning society, rendering them non-discretionary. Lately, innovation to address trends like water conservation has driven incremental sales. But like the broader industrials sector, infrastructure distributors are also at the whim of economic cycles as external factors like interest rates can greatly impact commercial and residential construction projects that drive demand for infrastructure products.
Sales Growth
Examining a company’s long-term performance can provide clues about its business quality. Any business can put up a good quarter or two, but the best consistently grow over the long haul. MRC Global’s demand was weak over the last five years as its sales fell by 3.9% annually, a rough starting point for our analysis.

Long-term growth is the most important, but within industrials, a half-decade historical view may miss new industry trends or demand cycles. MRC Global’s revenue over the last two years was flat, sugggesting its demand was weak but stabilized after its initial drop in sales. 
We can dig further into the company’s revenue dynamics by analyzing its most important segments, Valves and Fittings, which are 35.8% and 25.6% of revenue. Over the last two years, MRC Global’s Valves revenue (fluid control) averaged 5.3% year-on-year growth while its Fittings revenue (pipe connectors) averaged 1.6% growth.
This quarter, MRC Global reported a rather uninspiring 10.2% year-on-year revenue decline to $797 million of revenue, in line with Wall Street’s estimates.
Looking ahead, sell-side analysts expect revenue to grow 3.3% over the next 12 months, an improvement versus the last two years. While this projection indicates the market thinks its newer products and services will catalyze better performance, it is still below average for the sector.
Today’s young investors won’t have read the timeless lessons in Gorilla Game: Picking Winners In High Technology because it was written more than 20 years ago when Microsoft and Apple were first establishing their supremacy. But if we apply the same principles, then enterprise software stocks leveraging their own generative AI capabilities may well be the Gorillas of the future. So, in that spirit, we are excited to present our Special Free Report on a profitable, fast-growing enterprise software stock that is already riding the automation wave and looking to catch the generative AI next.
Operating Margin
Operating margin is a key measure of profitability. Think of it as net income–the bottom line–excluding the impact of taxes and interest on debt, which are less connected to business fundamentals.
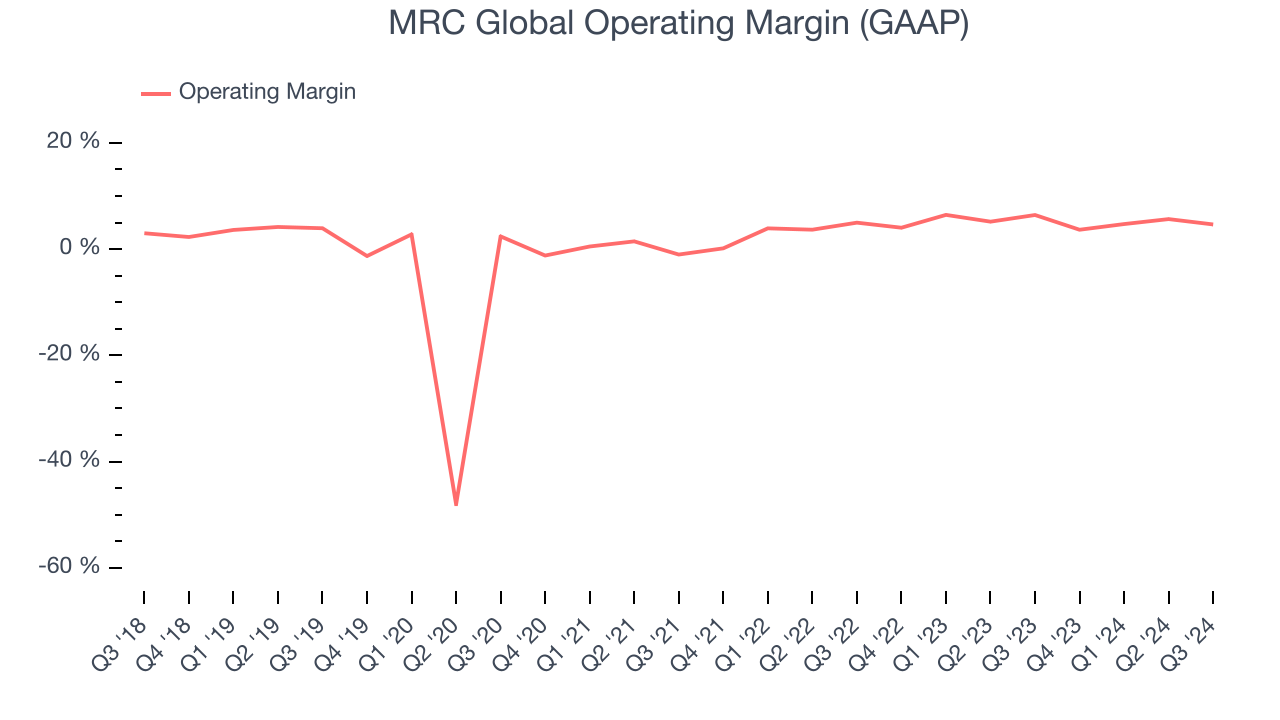
MRC Global was profitable over the last five years but held back by its large cost base. Its average operating margin of 1.2% was weak for an industrials business. This result isn’t too surprising given its low gross margin as a starting point.
On the plus side, MRC Global’s annual operating margin rose by 14.3 percentage points over the last five years.

In Q3, MRC Global generated an operating profit margin of 4.6%, down 1.8 percentage points year on year. Since MRC Global’s operating margin decreased more than its gross margin, we can assume it was recently less efficient because expenses such as marketing, R&D, and administrative overhead increased.
Earnings Per Share
We track the long-term change in earnings per share (EPS) for the same reason as long-term revenue growth. Compared to revenue, however, EPS highlights whether a company’s growth was profitable.
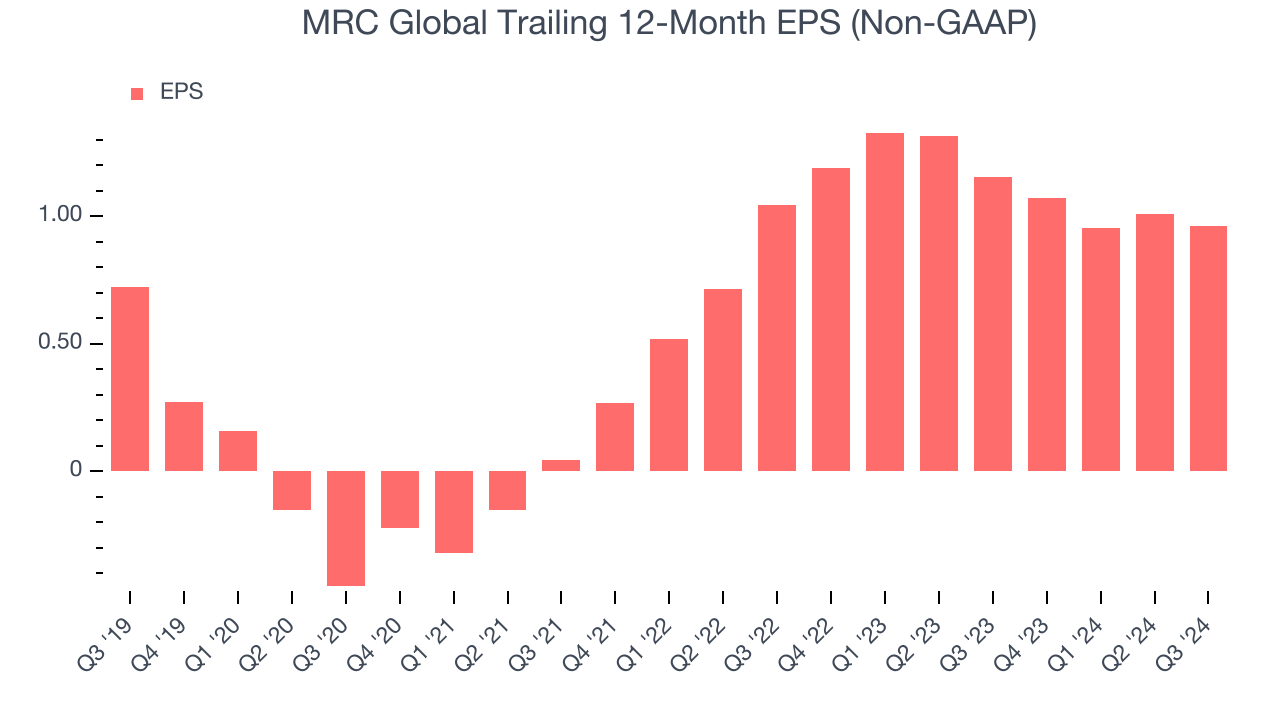
MRC Global’s EPS grew at an unimpressive 6% compounded annual growth rate over the last five years. On the bright side, this performance was better than its 3.9% annualized revenue declines and tells us management adapted its cost structure in response to a challenging demand environment.

We can take a deeper look into MRC Global’s earnings to better understand the drivers of its performance. As we mentioned earlier, MRC Global’s operating margin declined this quarter but expanded by 14.3 percentage points over the last five years. This was the most relevant factor (aside from the revenue impact) behind its higher earnings; taxes and interest expenses can also affect EPS but don’t tell us as much about a company’s fundamentals.
Like with revenue, we analyze EPS over a shorter period to see if we are missing a change in the business.
For MRC Global, its two-year annual EPS declines of 3.9% show it’s continued to underperform. These results were bad no matter how you slice the data.In Q3, MRC Global reported EPS at $0.22, down from $0.26 in the same quarter last year. Despite falling year on year, this print easily cleared analysts’ estimates. Over the next 12 months, Wall Street expects MRC Global’s full-year EPS of $0.96 to grow by 16%.
Key Takeaways from MRC Global’s Q3 Results
Revenue was just in line, but MRC Global exceeded analysts’ EPS expectations this quarter by a convincing amount. Holding aside expectations, we liked seeing a big year on year improvement in free cash flow margin. Overall, this quarter had some key positives. The stock traded up 3.6% to $13.07 immediately after reporting.
Is MRC Global an attractive investment opportunity right now? When making that decision, it’s important to consider its valuation, business qualities, as well as what has happened in the latest quarter. We cover that in our actionable full research report which you can read here, it’s free.


